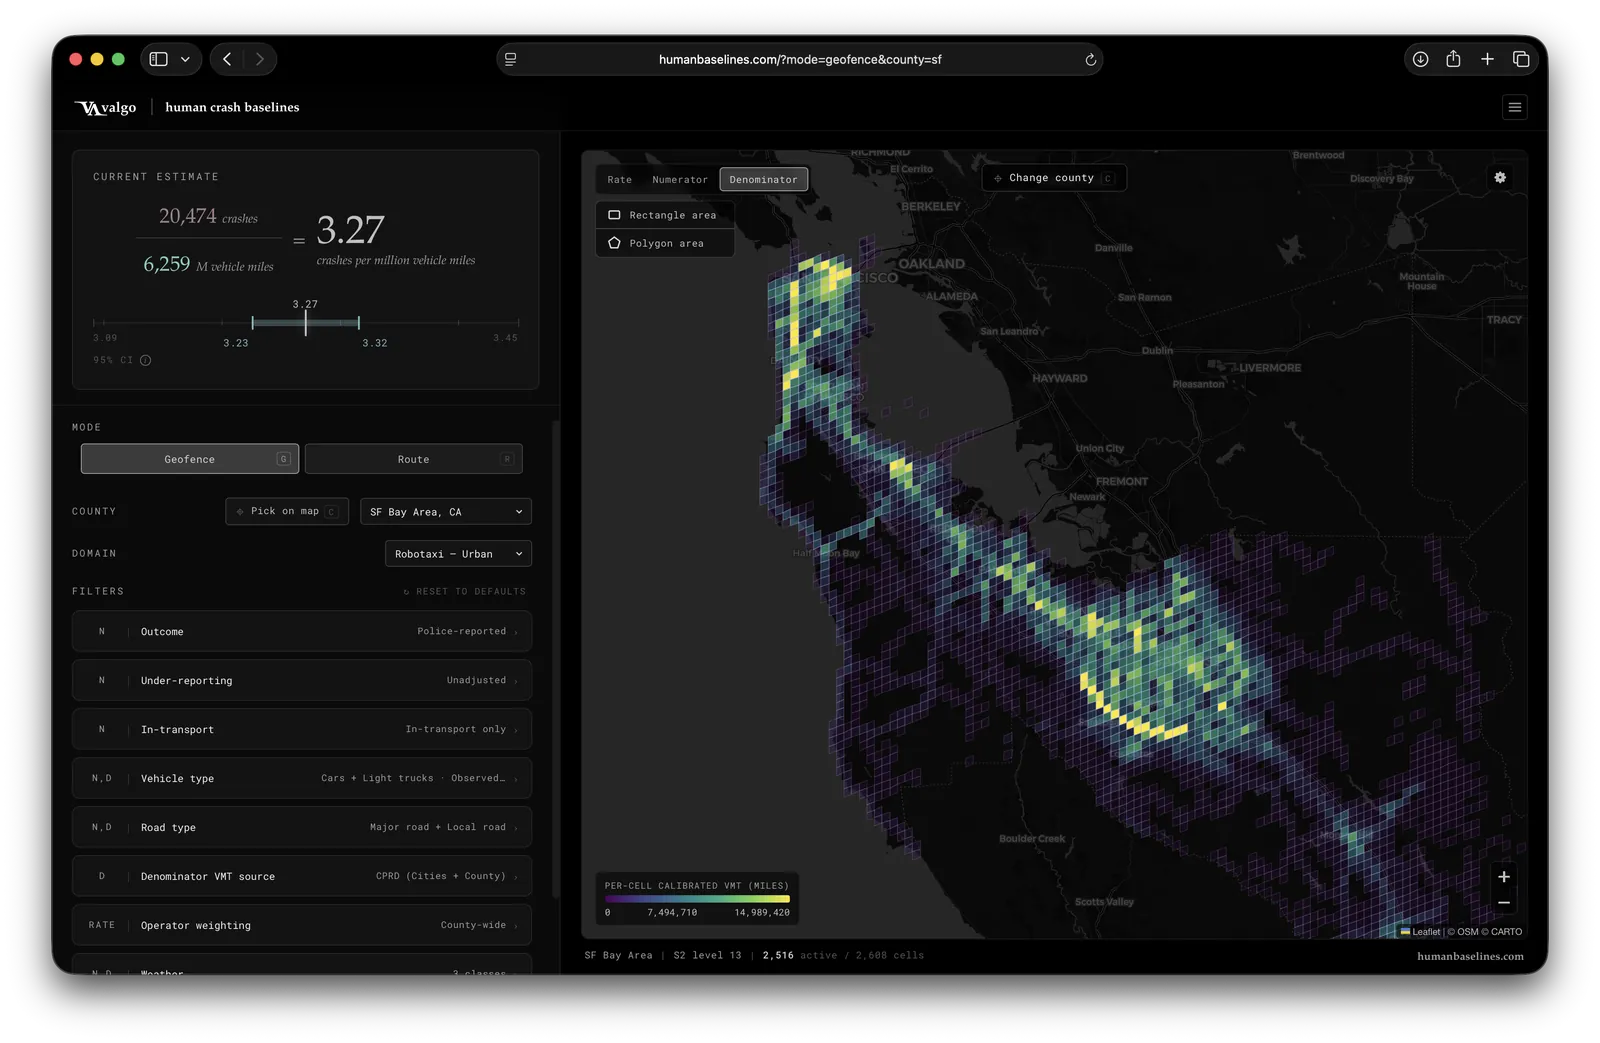
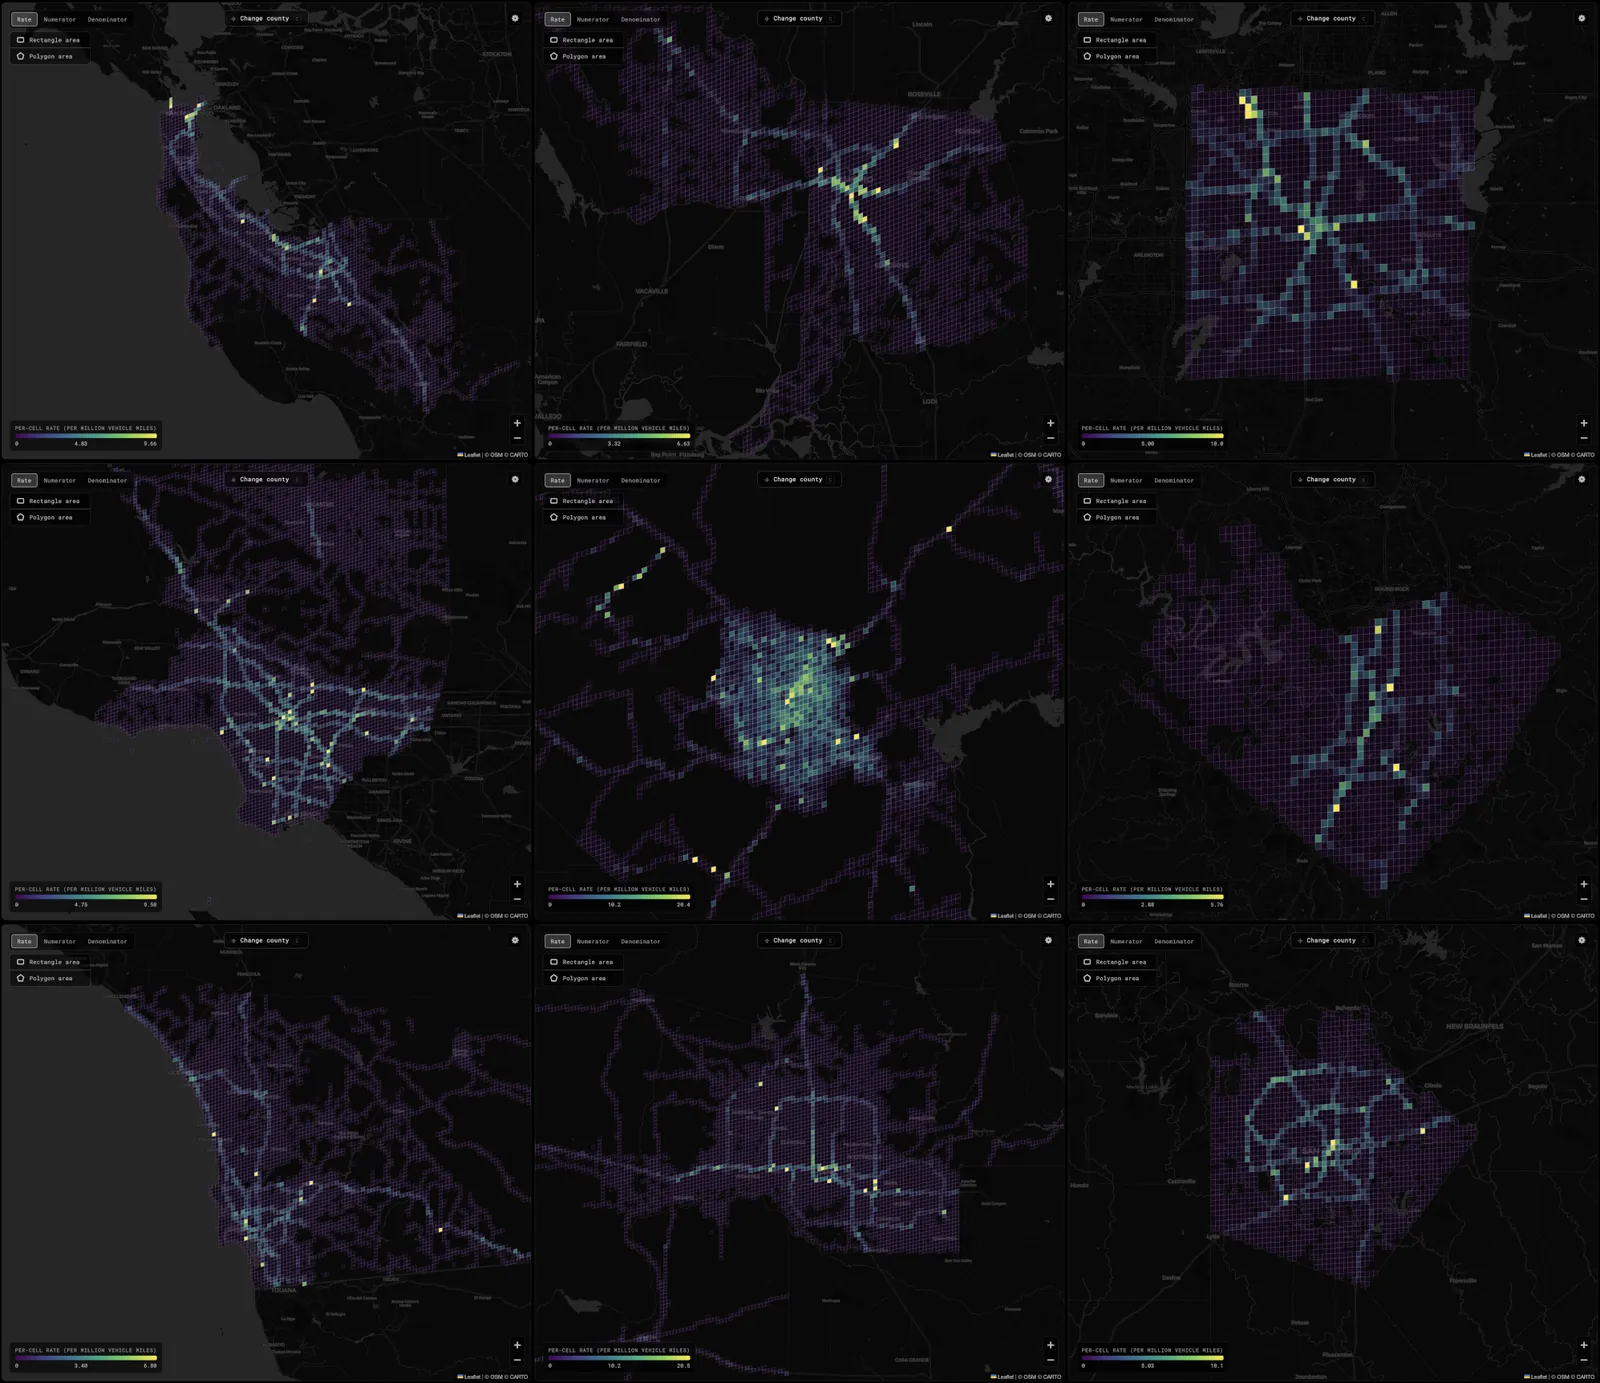
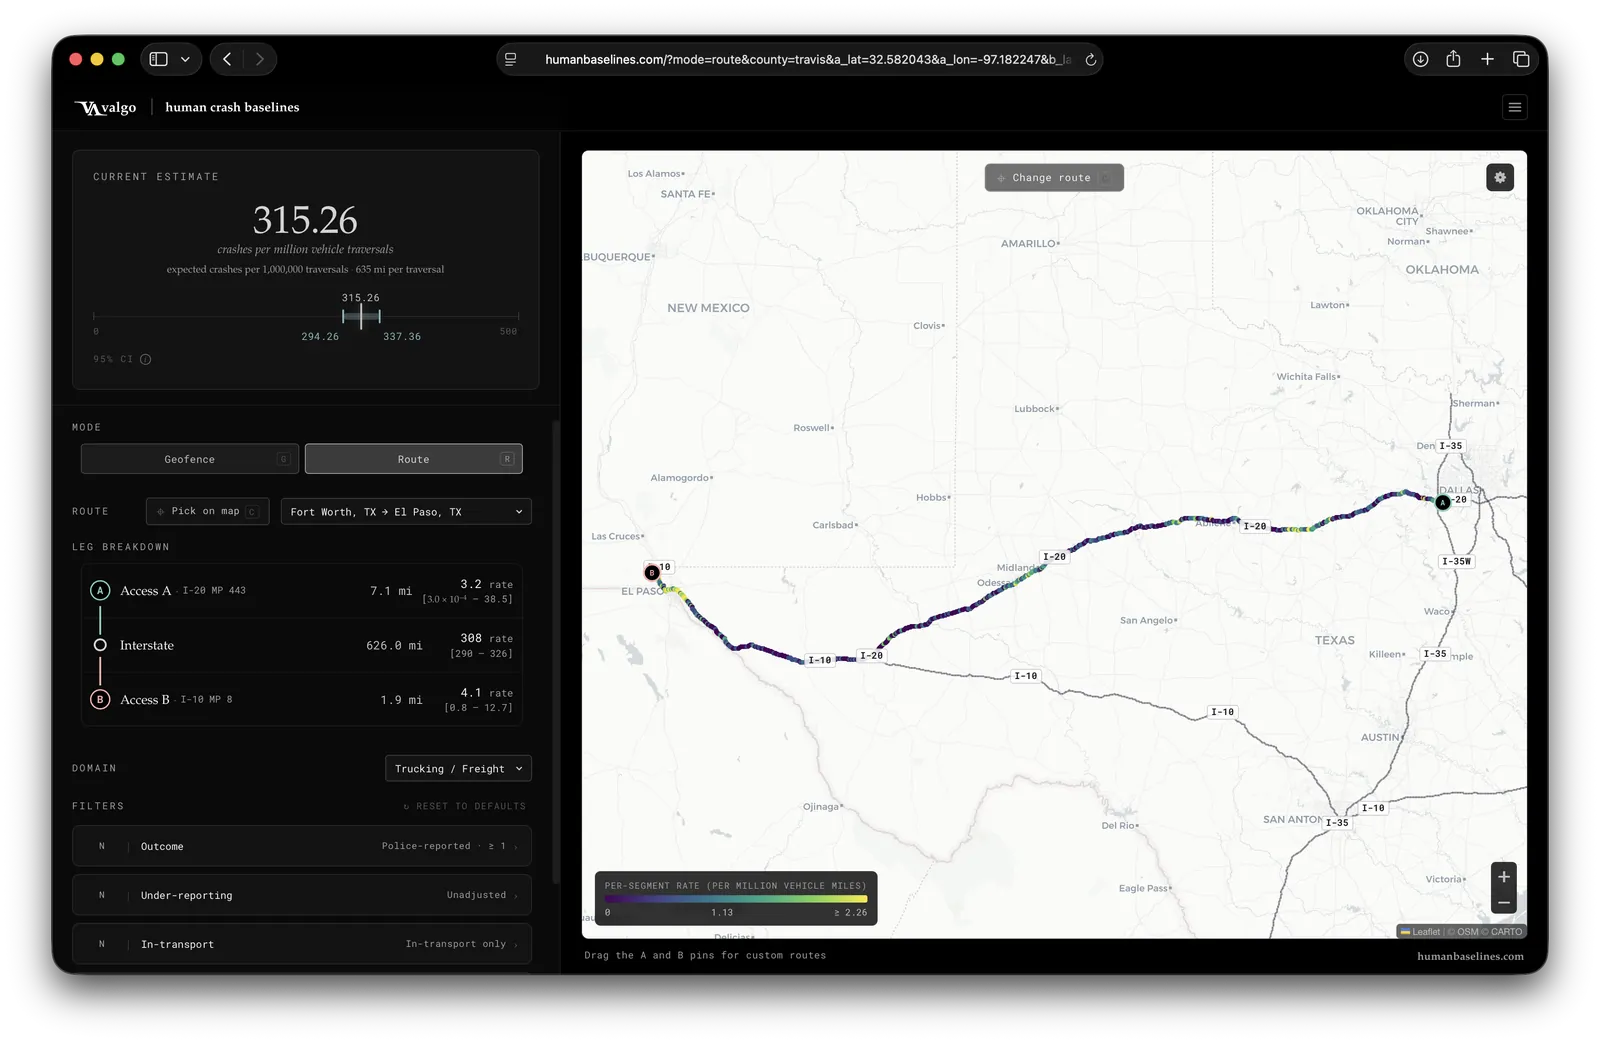
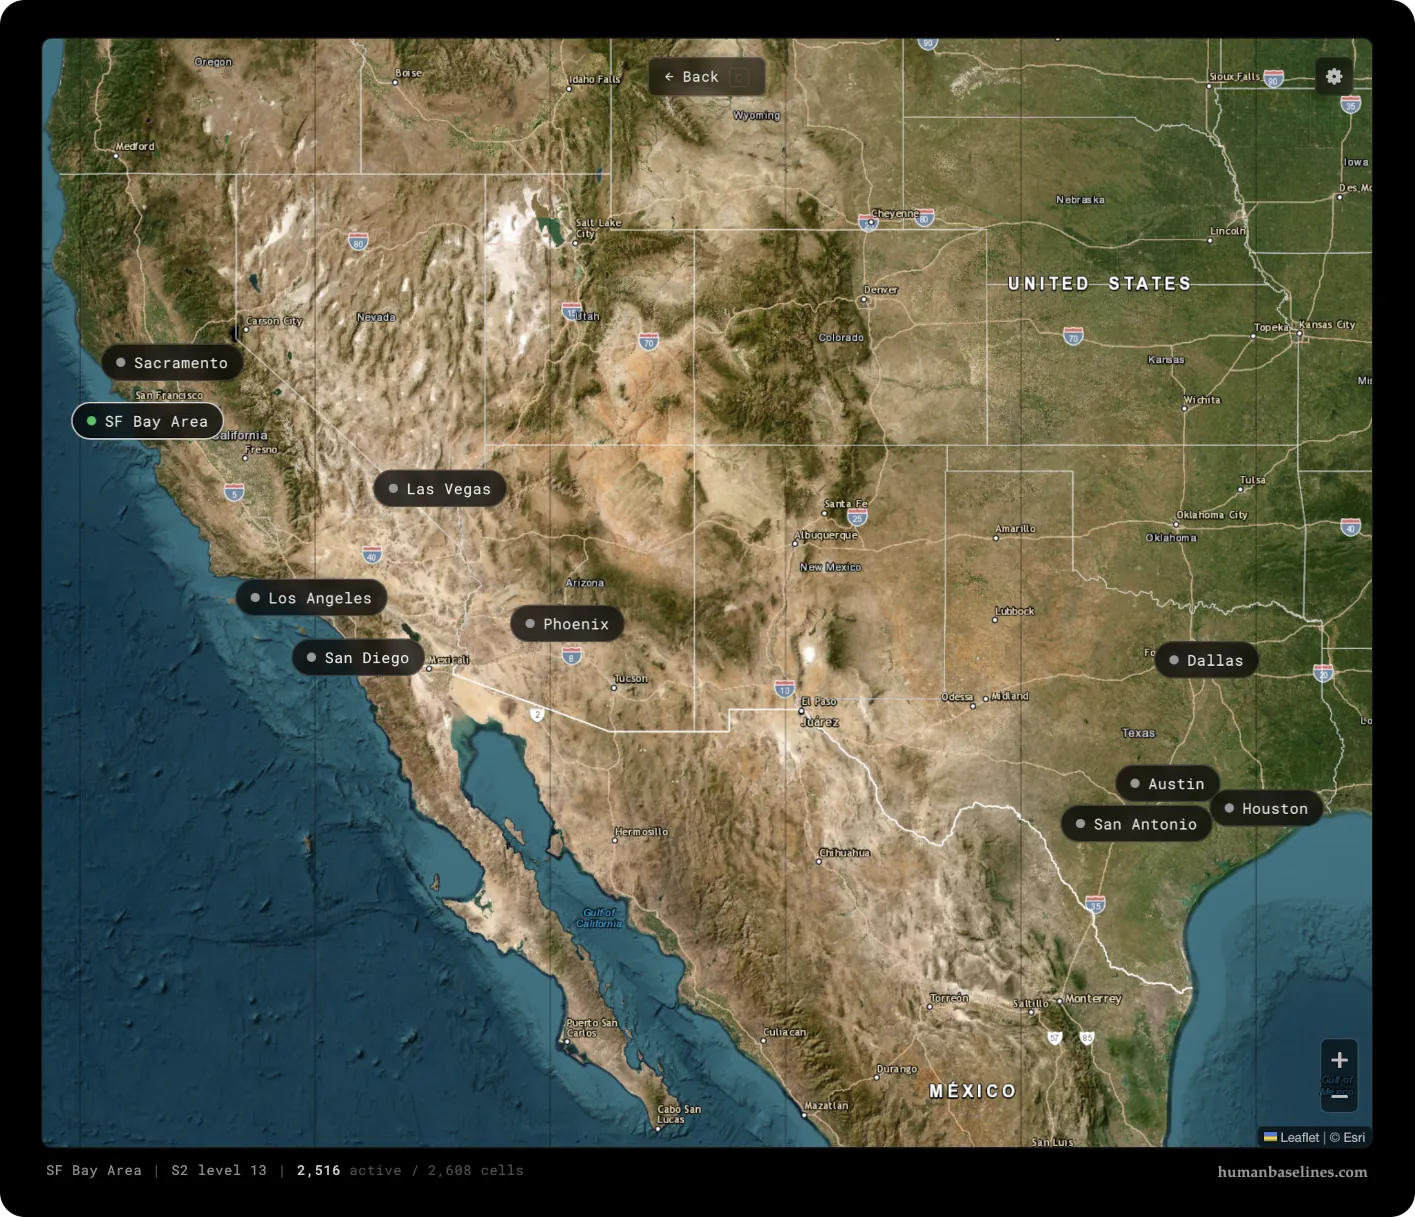
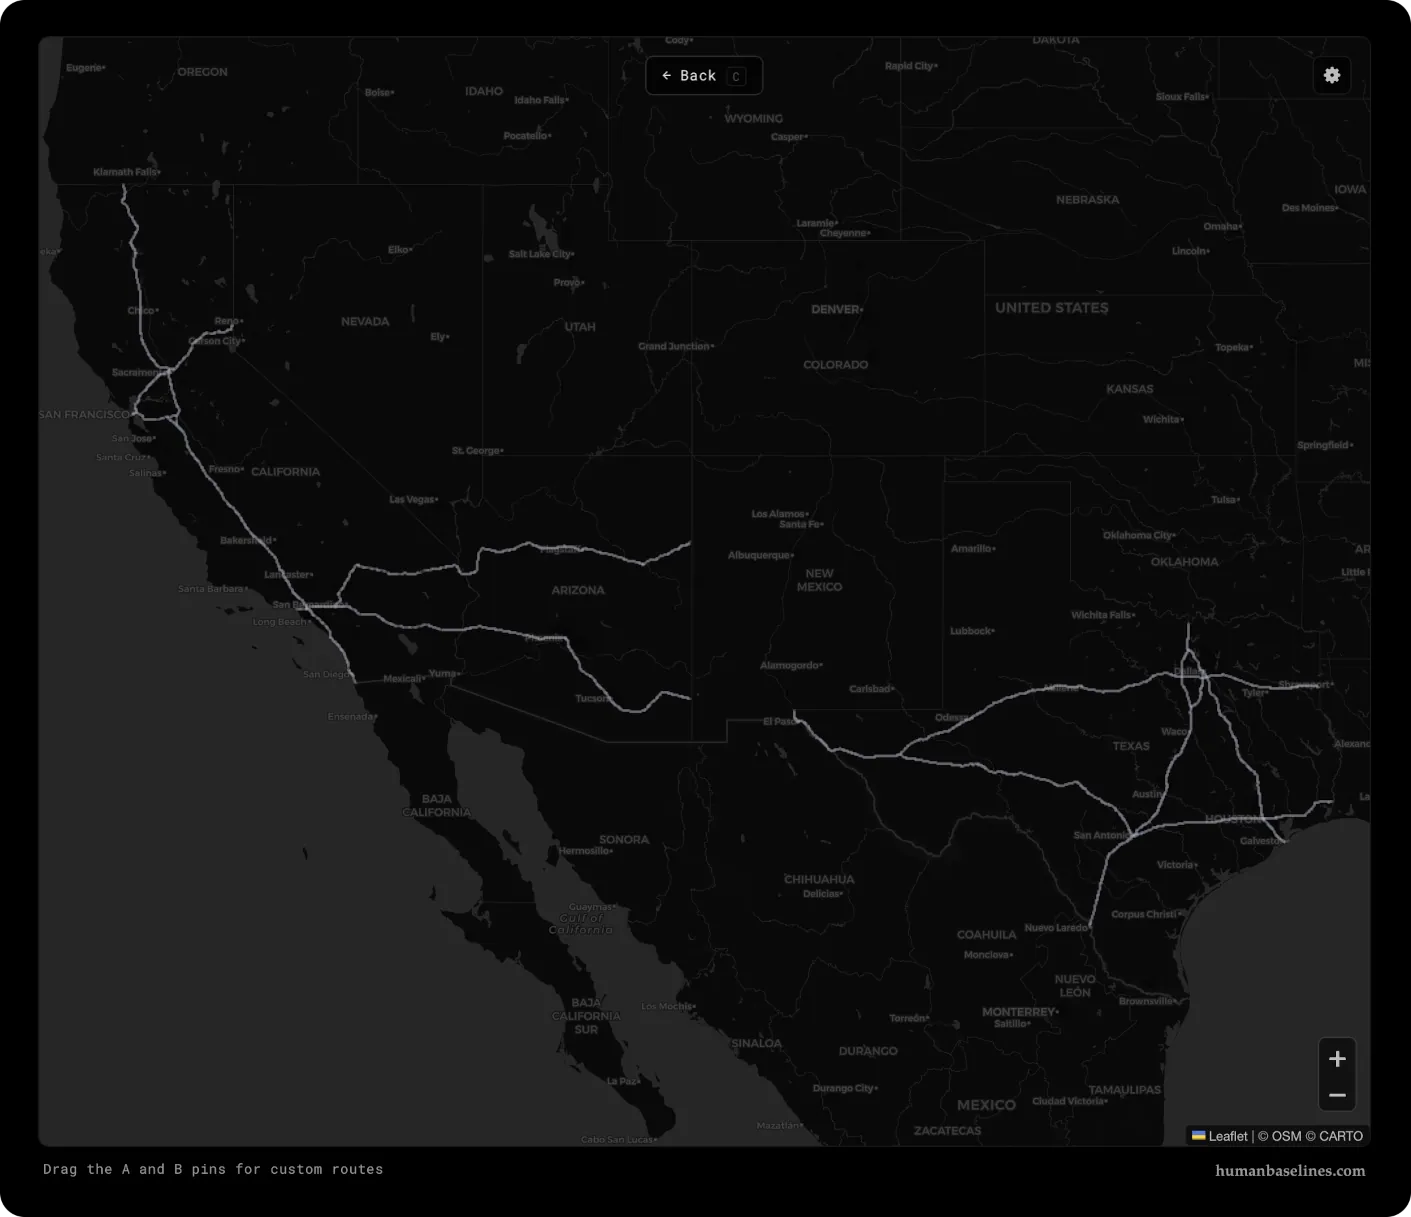
To assess autonomous vehicle safety relative to humans, we started looking for human crash rate statistics. Despite all the published work on AV safety benchmarking and public data on human crashes, there was no single tool where stakeholders could get answers to their own specific questions. Comparing automated driving performance against humans is a necessary (but not sufficient) step for measuring safety, especially as more autonomy reaches public roads. We believe these baselines should be shaped by a variety of stakeholders across the community, so we built and released a tool for human crash baselines, open for public judgment and feedback. We all benefit from clarity in the methodology and decisions that go into answering "how to compare AVs against a human."
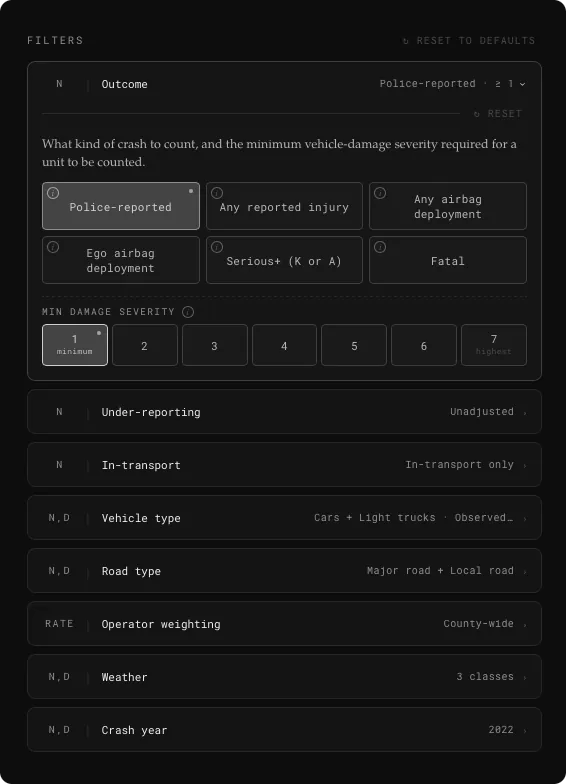
Computing a human crash rate, at first glance, looks like simple division: crashes over miles driven. In practice, the resulting crash rate changes drastically depending on the decisions made in how we define "crashes" and "miles driven." Are we only looking at police-reported crashes? We know not every crash is always reported.1The less severe a crash, the less likely it ends up in police records. Reported counts understate the true total (and by different amounts depending on severity). NHTSA estimates roughly 2.48 property-damage-only crashes and 1.47 non-fatal injury crashes for every one reported, while essentially all fatal crashes are captured (x 1.00). Multipliers are from Blincoe, Miller, Wang, et al., "The Economic and Societal Impact of Motor Vehicle Crashes, 2019 (Revised)," NHTSA report DOT HS 813 403 (2023). 1 The less severe a crash, the less likely it ends up in police records. Reported counts understate the true total (and by different amounts depending on severity). NHTSA estimates roughly 2.48 property-damage-only crashes and 1.47 non-fatal injury crashes for every one reported, while essentially all fatal crashes are captured (x 1.00). Multipliers are from Blincoe, Miller, Wang, et al., "The Economic and Societal Impact of Motor Vehicle Crashes, 2019 (Revised)," NHTSA report DOT HS 813 403 (2023). What vehicle types are appropriate to compare against? Passenger cars? Heavy-duty trucks? Buses? The domain the AV operates in matters.2The AV industry uses the term operational design domain (ODD) to refer to the specific set of environments and conditions under which a system is intended to operate. 2 The AV industry uses the term operational design domain (ODD) to refer to the specific set of environments and conditions under which a system is intended to operate. For example, it would be unfair to include highway driving if we're only operating on local roads, knowing highways carry different risks. These are all decisions made by stakeholders when estimating a human crash baseline for their specific purpose. A helpful way to visualize how much these methodology choices matter is the specification curve below.3Specification curves are a common tool in social science for showing how a result varies across different defensible choices. One of their first use cases was to show how varying assumptions affect the hypothesis that hurricanes with female names are deadlier. Specification curve analysis was introduced in Simonsohn, Simmons, and Nelson, "Specification curve analysis," Nature Human Behaviour 4, 1208–1214 (2020), doi:10.1038/s41562-020-0912-z. 3 Specification curves are a common tool in social science for showing how a result varies across different defensible choices. One of their first use cases was to show how varying assumptions affect the hypothesis that hurricanes with female names are deadlier. Specification curve analysis was introduced in Simonsohn, Simmons, and Nelson, "Specification curve analysis," Nature Human Behaviour 4, 1208–1214 (2020), doi:10.1038/s41562-020-0912-z. It shows the crash rate under every combination of choices at once. It is important to compare AV operators with the combination that matches their specific ODD for a fair assessment of safety. The choice might be a moving target as operators expand their ODD.
The tool (humanbaselines.com) enables users to interactively make choices corresponding to their ODD of interest across both urban geofenced environments and highway trucking corridors. This tool builds on established research in AV safety benchmarking and human-comparison methodologies,4We build on the published human-benchmarking methodology in Scanlon et al. 2026 (SAE International), Kusano et al. 2025 (Traffic Injury Prevention), and Chen et al. 2025 (Transportation Research Record), among other public sources and methods including Goodall (2024), Chen et al. (2024), Scanlon et al. (2024), Di Lillo et al. (2024), Cummings (2024), Flannagan et al. (2023), Goodall (2021), and Kalra et al. (2016). 4 We build on the published human-benchmarking methodology in Scanlon et al. 2026 (SAE International), Kusano et al. 2025 (Traffic Injury Prevention), and Chen et al. 2025 (Transportation Research Record), among other public sources and methods including Goodall (2024), Chen et al. (2024), Scanlon et al. (2024), Di Lillo et al. (2024), Cummings (2024), Flannagan et al. (2023), Goodall (2021), and Kalra et al. (2016). developed for robotaxis, and extended here to autonomous trucking routes. It represents an independent replication and extension of the peer-reviewed methodologies published by the Waymo Safety Research team.5We follow the best practices from the RAVE (Retrospective Automated Vehicle Evaluation) checklist, shown in our white paper. RAVE was a study led by Waymo that resulted in a set of fifteen recommendations for conducting and evaluating retrospective studies that compare automated driving systems against human crash rates. John M. Scanlon, Eric R. Teoh, David G. Kidd, Kristofer D. Kusano, Jonas Bärgman, Geoffrey Chiohnston, et al. “RAVE checklist: Recommendations for overcoming challenges in retrospective safety studies of automated driving systems.” Traffic Injury Prevention 26.5 (2025), pp. 608–621, doi.org/10.1080/15389588.2024.2435620. 5 We follow the best practices from the RAVE (Retrospective Automated Vehicle Evaluation) checklist, shown in our white paper. RAVE was a study led by Waymo that resulted in a set of fifteen recommendations for conducting and evaluating retrospective studies that compare automated driving systems against human crash rates. John M. Scanlon, Eric R. Teoh, David G. Kidd, Kristofer D. Kusano, Jonas Bärgman, Geoffrey Chiohnston, et al. “RAVE checklist: Recommendations for overcoming challenges in retrospective safety studies of automated driving systems.” Traffic Injury Prevention 26.5 (2025), pp. 608–621, doi.org/10.1080/15389588.2024.2435620. The tool can be used to directly compare human-driver safety to Waymo’s regularly published driving data and can be used to make similar comparisons for other AV operators.
Because these choices are judgment calls as much as technical ones, we intend the tool to grow as a community resource. We welcome contributions, discussions, and critical feedback on the data sources and methods. The data is all public,6Crash records come from state DOTs (Texas, California, Arizona, Nevada), roadway exposure from FHWA HPMS and state traffic counts, weather from NOAA, and base maps from OpenStreetMap. Every source, with links and license terms, is listed in the tool's "Data Sources & Attributions." 6 Crash records come from state DOTs (Texas, California, Arizona, Nevada), roadway exposure from FHWA HPMS and state traffic counts, weather from NOAA, and base maps from OpenStreetMap. Every source, with links and license terms, is listed in the tool's "Data Sources & Attributions." every methodological choice is something you can change and track in the tool, and we expect people to find things we missed. That's a big reason we put it out there.
For technical details, please read the white paper. Feedback can be sent to [email protected], and you can request API access here.7Python API can be installed via pip install humanbaselines. The repository is located at https://github.com/valgorithmic/humanbaselines and the API documentation is located at https://docs.humanbaselines.com. 7 Python API can be installed via pip install humanbaselines. The repository is located at https://github.com/valgorithmic/humanbaselines and the API documentation is located at https://docs.humanbaselines.com.
Valgo is a public benefit corporation that models risk for the validation, deployment, and insurance of physical AI. Our mission is to advance risk quantification methods to benefit those who use, design, operate, or regulate autonomous systems and the communities and environments in which these systems are deployed. We model real-world operating environments and turn testing and simulation data into clear insights that inform deployment decisions and insurance underwriting. As an independent, trusted layer between developers, operators, insurers, and regulators, Valgo helps accelerate the safe and timely deployment of autonomy.
Press inquiries: [email protected]
-
The less severe a crash, the less likely it ends up in police records. Reported counts understate the true total (and by different amounts depending on severity). NHTSA estimates roughly 2.48 property-damage-only crashes and 1.47 non-fatal injury crashes for every one reported, while essentially all fatal crashes are captured (x 1.00). Multipliers are from Blincoe, Miller, Wang, et al., "The Economic and Societal Impact of Motor Vehicle Crashes, 2019 (Revised)," NHTSA report DOT HS 813 403 (2023). ↩
-
The AV industry uses the term operational design domain (ODD) to refer to the specific set of environments and conditions under which a system is intended to operate. ↩
-
Specification curves are a common tool in social science for showing how a result varies across different defensible choices. One of their first use cases was to show how varying assumptions affect the hypothesis that hurricanes with female names are deadlier. Specification curve analysis was introduced in Simonsohn, Simmons, and Nelson, "Specification curve analysis," Nature Human Behaviour 4, 1208–1214 (2020), doi:10.1038/s41562-020-0912-z. ↩
-
We build on the published human-benchmarking methodology in Scanlon et al. 2026 (SAE International), Kusano et al. 2025 (Traffic Injury Prevention), and Chen et al. 2025 (Transportation Research Record), among other public sources and methods including Goodall (2024), Chen et al. (2024), Scanlon et al. (2024), Di Lillo et al. (2024), Cummings (2024), Flannagan et al. (2023), Goodall (2021), and Kalra et al. (2016). ↩
-
We follow the best practices from the RAVE (Retrospective Automated Vehicle Evaluation) checklist, shown in our white paper. RAVE was a study led by Waymo that resulted in a set of fifteen recommendations for conducting and evaluating retrospective studies that compare automated driving systems against human crash rates. John M. Scanlon, Eric R. Teoh, David G. Kidd, Kristofer D. Kusano, Jonas Bärgman, Geoffrey Chiohnston, et al. “RAVE checklist: Recommendations for overcoming challenges in retrospective safety studies of automated driving systems.” Traffic Injury Prevention 26.5 (2025), pp. 608–621, doi.org/10.1080/15389588.2024.2435620. ↩
-
Crash records come from state DOTs (Texas, California, Arizona, Nevada), roadway exposure from FHWA HPMS and state traffic counts, weather from NOAA, and base maps from OpenStreetMap. Every source, with links and license terms, is listed in the tool's "Data Sources & Attributions." ↩
-
Python API can be installed via
pip install humanbaselines. The repository is located at https://github.com/valgorithmic/humanbaselines and the API documentation is located at https://docs.humanbaselines.com. ↩